Technical Systems, Diagrams & Workflows
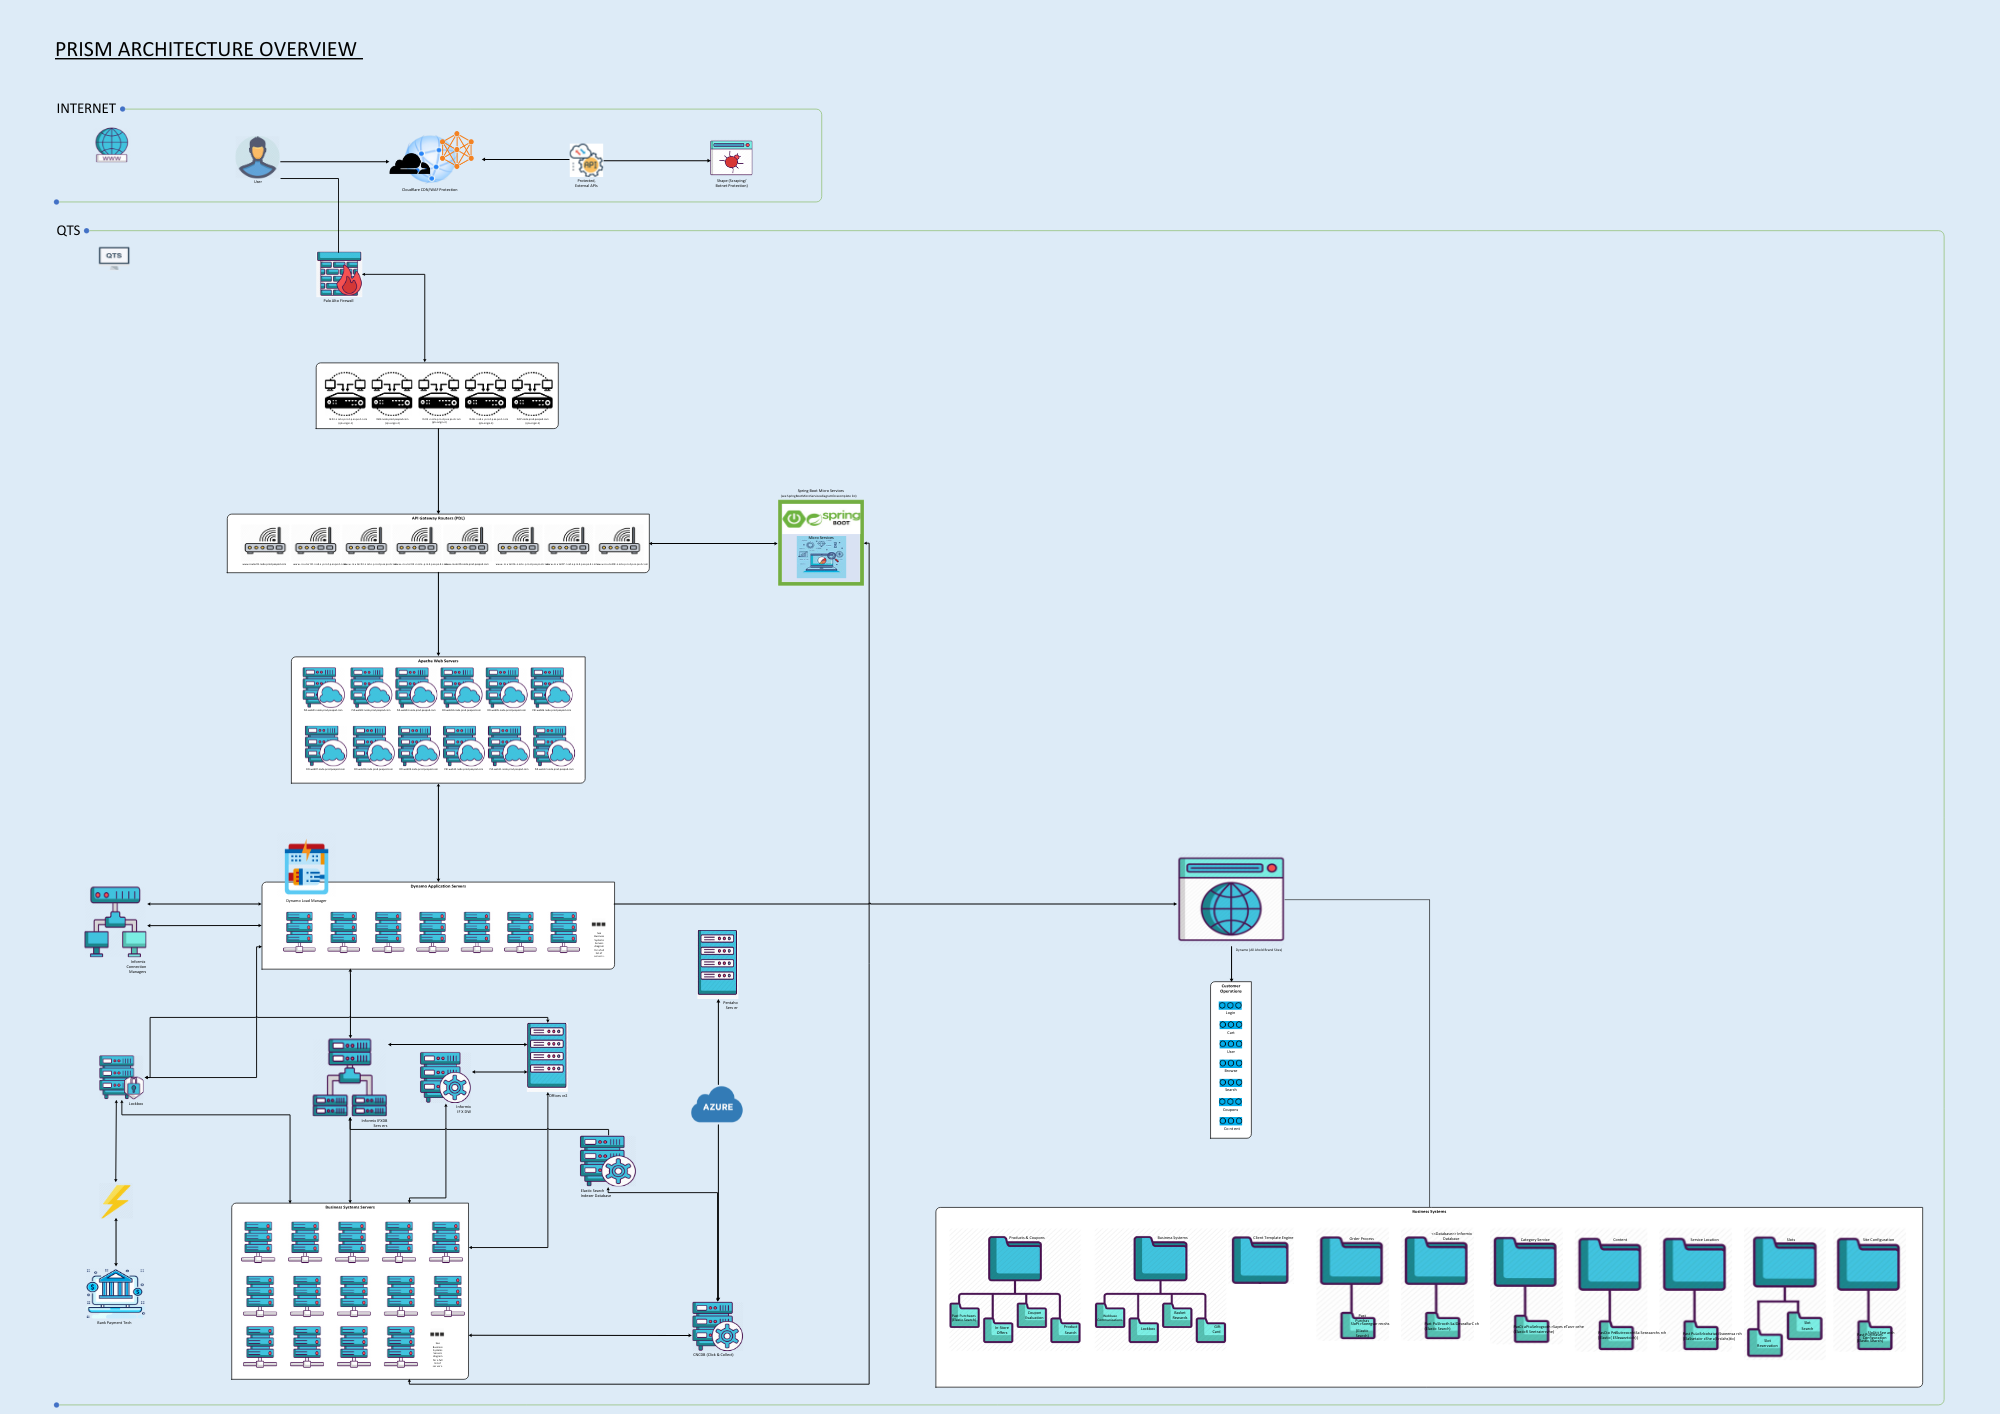
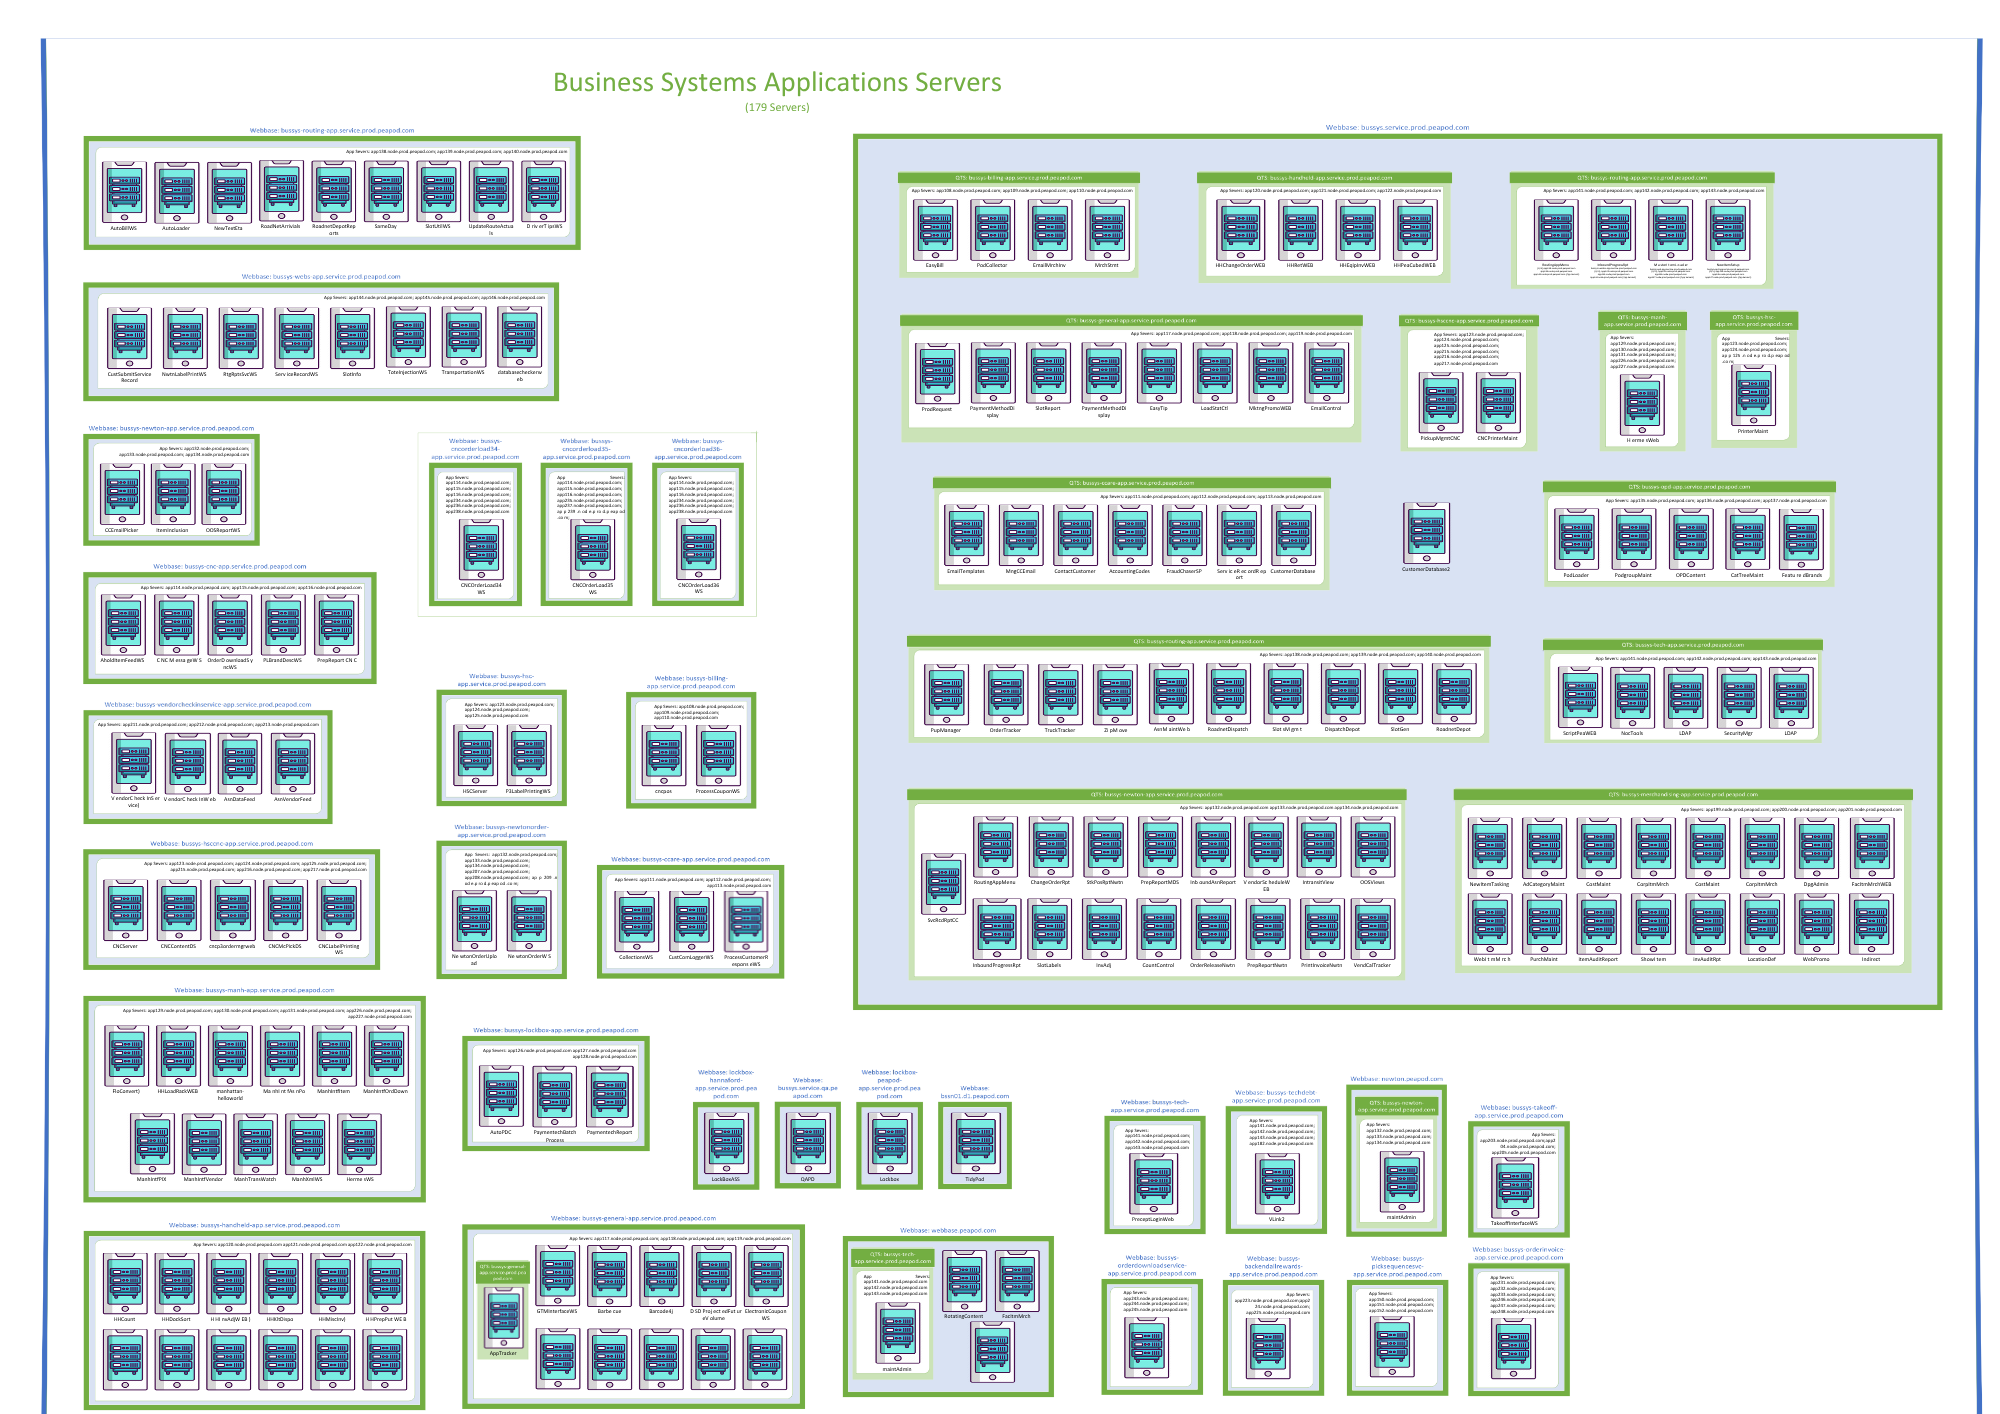
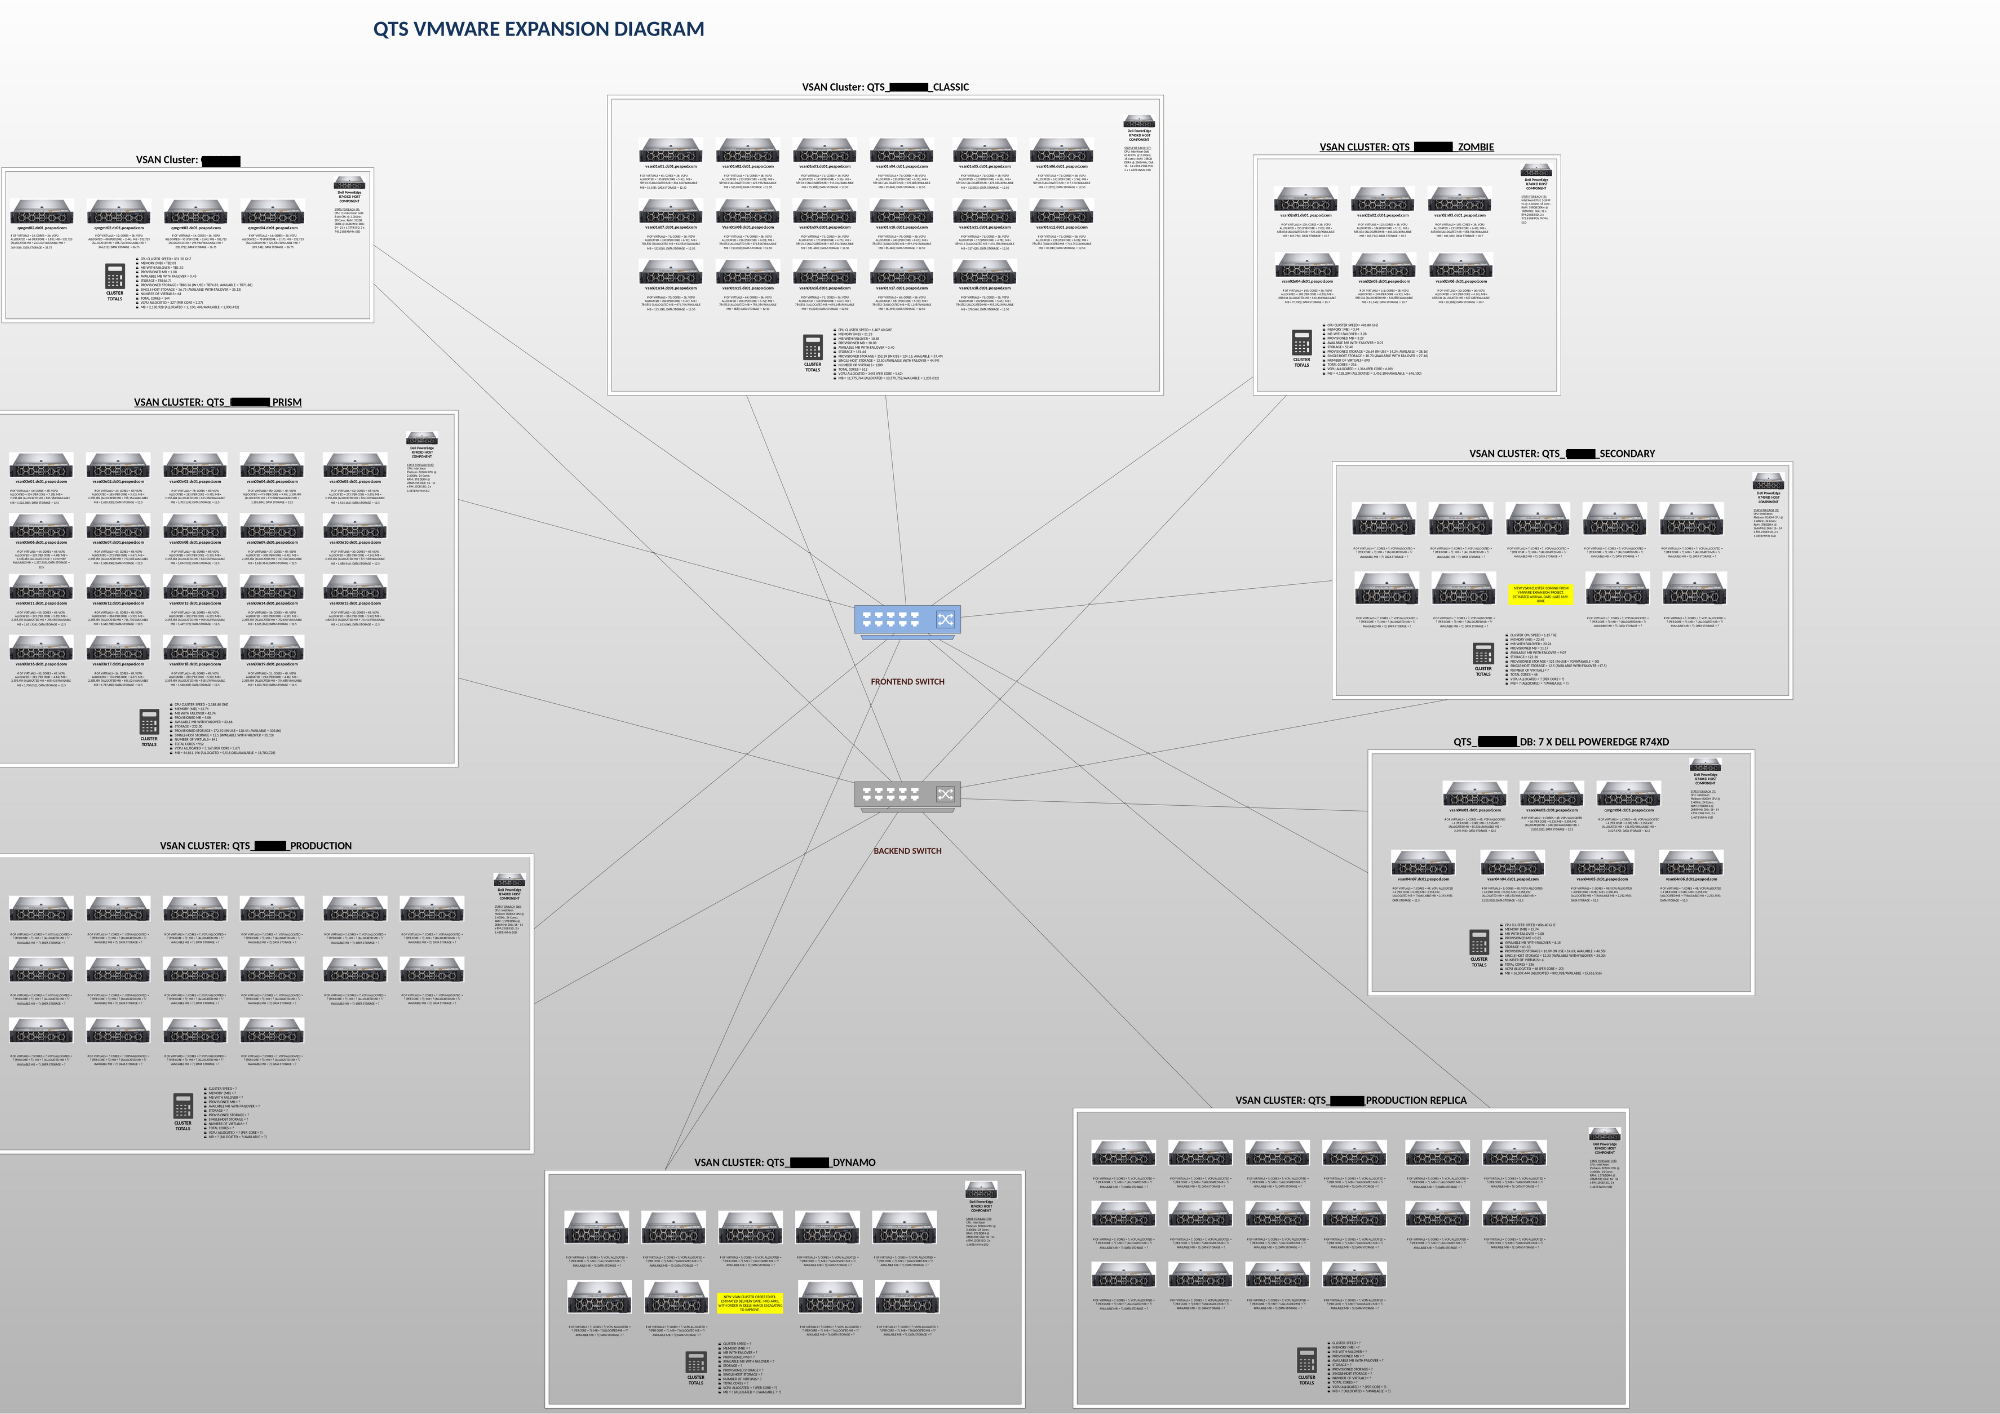
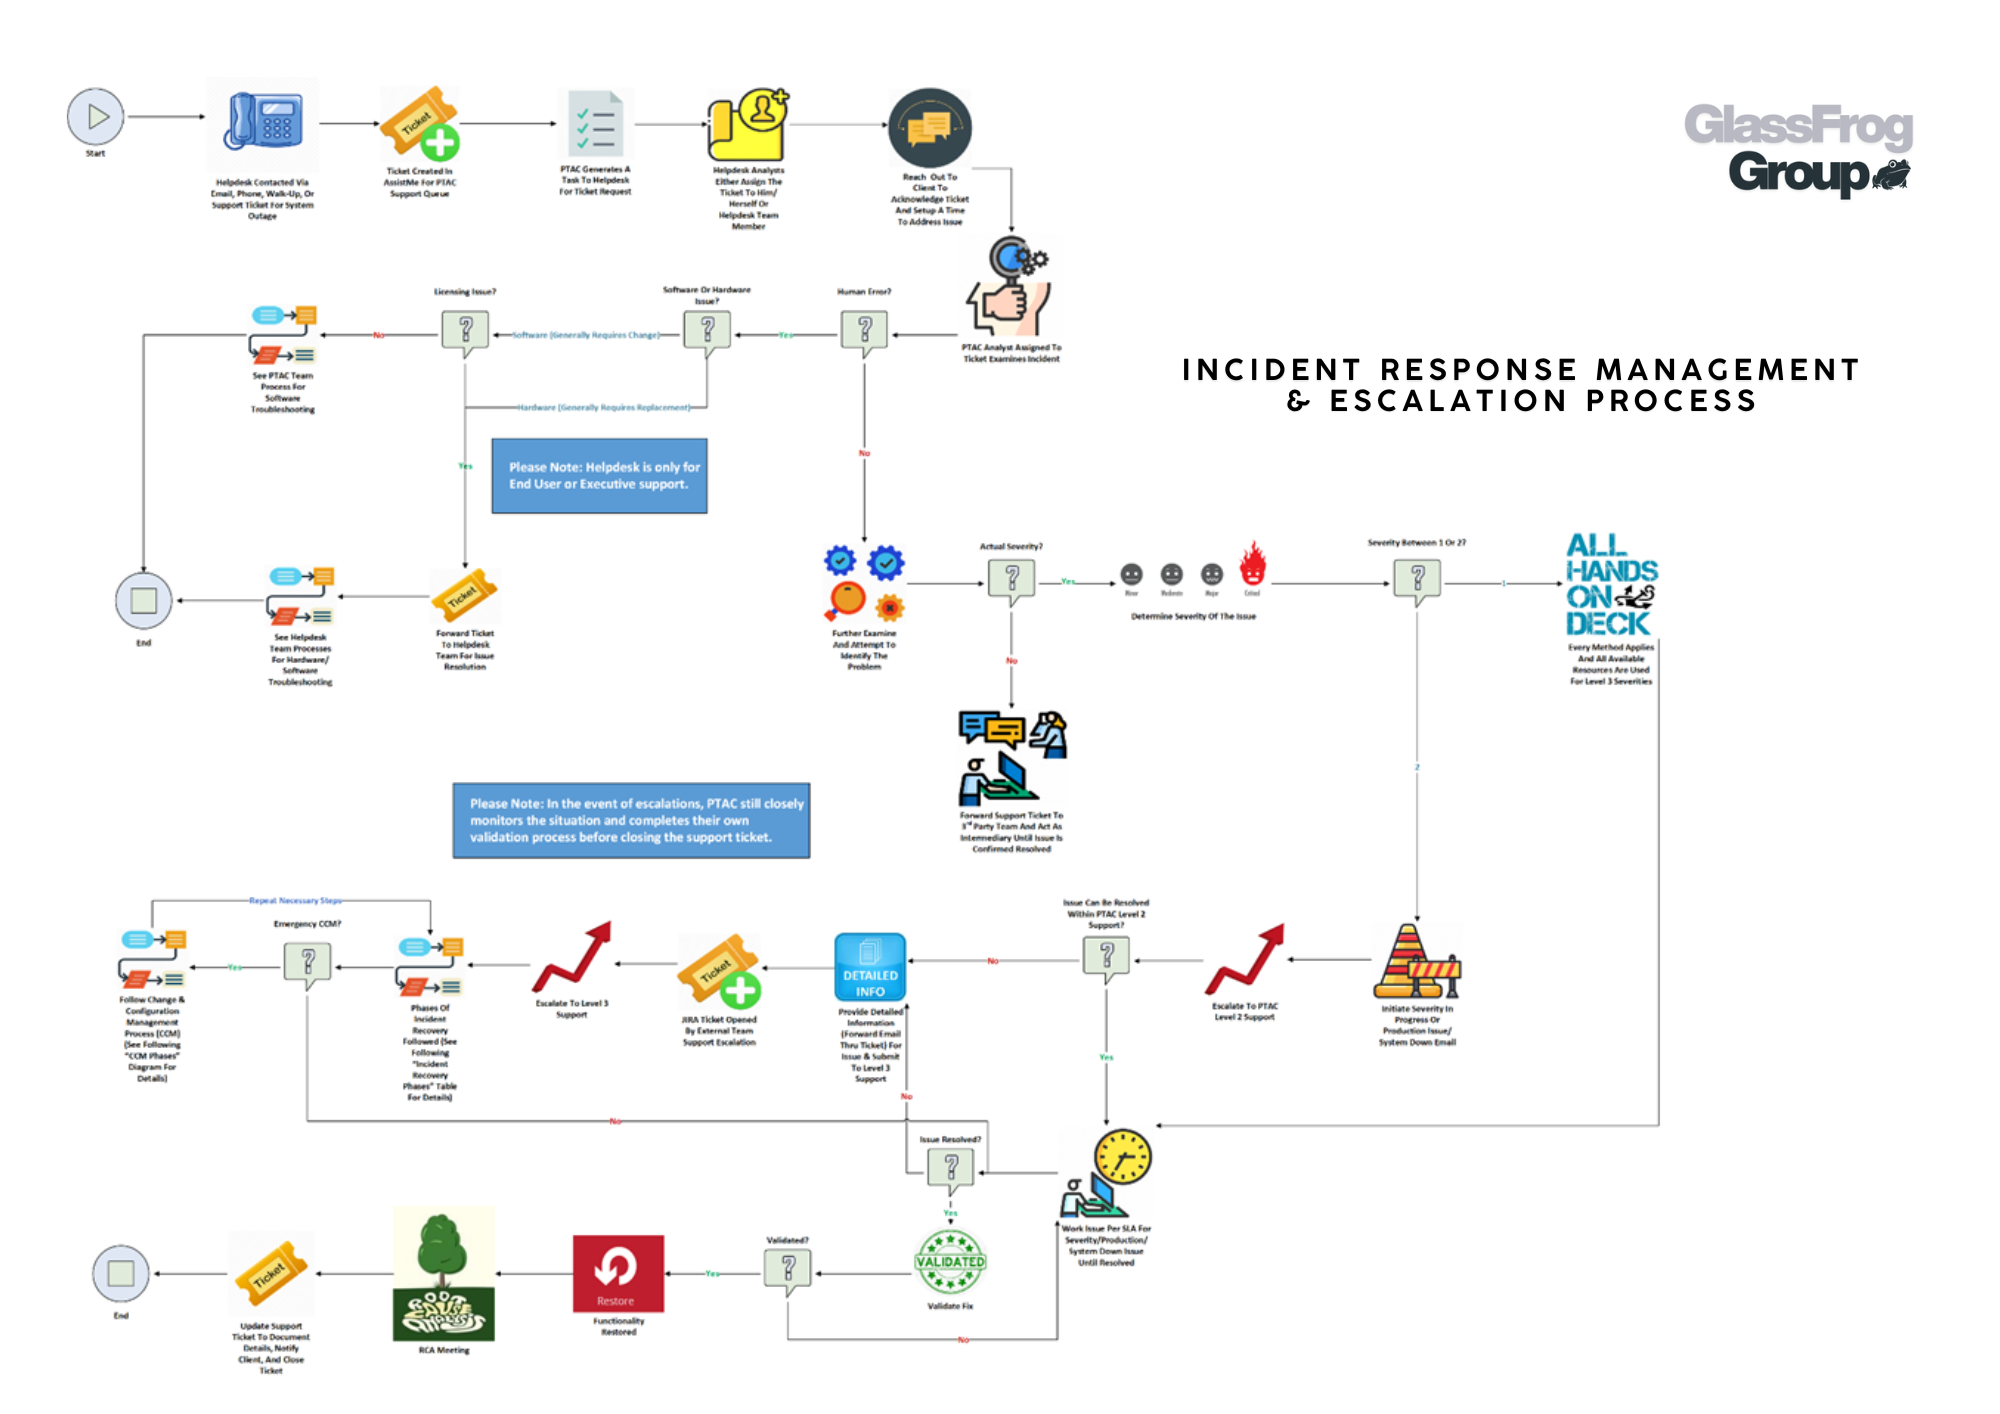
Network architecture diagrams, infrastructure maps, and process workflows transform complexity into clarity. These visual frameworks illustrate how systems, teams, and technologies connect—driving alignment across Information Technology (IT) and other operational environments.
By combining technical accuracy with intuitive communication, they help teams visualize systems, streamline decision-making, and design scalable, efficient solutions. Below are redacted examples showcasing how visual structure and concise language support system design, documentation, and user enablement. The work samples featured on this page have been recreated or redacted from their original state to protect Intellectual Property (IP).
Functional Benefits of Visual Frameworks
Clarity in Connectivity: Maps out the physical and logical links between servers, databases, and end-users.
Decision Acceleration: Provides a single source of truth for stakeholders to evaluate changes or upgrades.
Risk Mitigation: Identifies single points of failure within a system before they impact production.